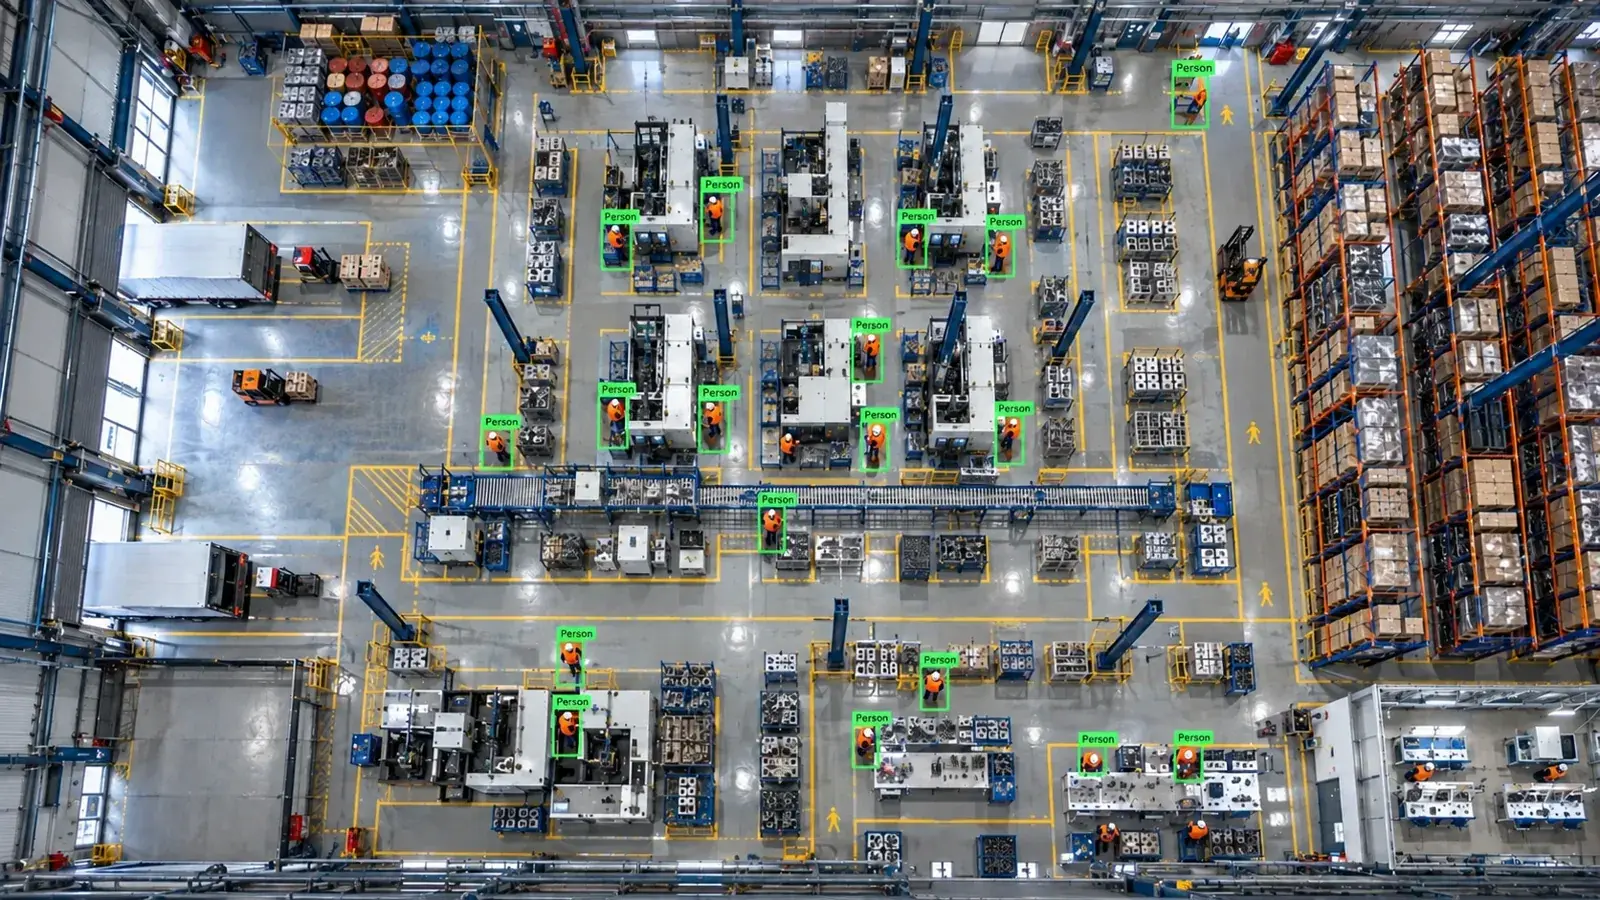
Density and bottleneck analysis on packing lines: which station slows the line?At a fresh-produce packing plant, existing cameras measured unit counts, active working time and line density per station; bottleneck stations and hours were identified with data.2026-10-12
At a plant sorting and boxing fresh vegetables, line capacity was the same on paper, yet end-of-day box counts differed widely between stations. Nobody knew which point was slowing the line. Hype Vision used the existing cameras covering the lines to measure how much each station processed and how actively it worked.
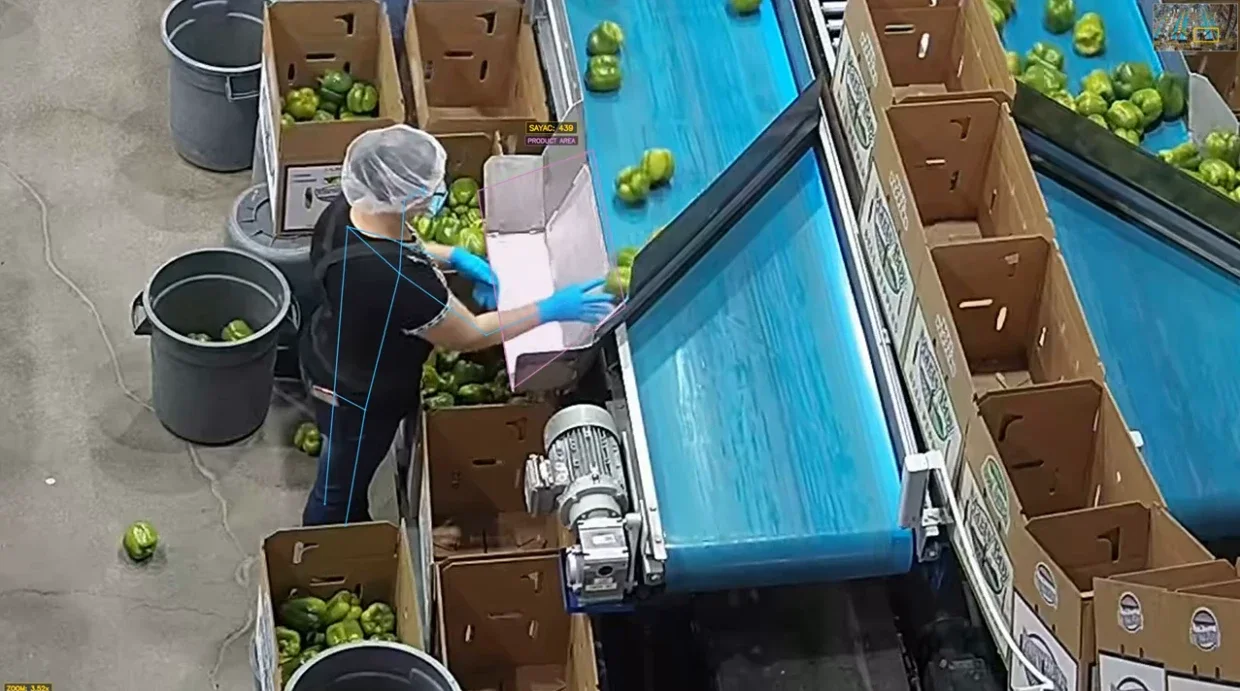
Belt speed was set the same for the whole line, but product piled up at some stations while staff waited idle at others.
Each station was defined as a product area (ROI) in the camera view.
Bottleneck stations and hours identified with data; Staffing re-planned according to station load; Line density and build-up monitored live
Problem
Belt speed was set the same for the whole line, but product piled up at some stations while staff waited idle at others. Only the total box count was known at the end of the shift; where time was lost was invisible.
How we measured
Each station was defined as a product area (ROI) in the camera view. Products moving from the area into boxes are counted; anonymous pose analysis separates active working time from waiting. Product density on the belt is measured from the same image.
- Products / boxes per station
- Active work vs. idle waiting time
- Product density and build-up on the belt
- Hourly throughput curve and shift comparison
Finding the bottleneck
Placing every station's hourly throughput side by side clearly showed that certain stations and hours were holding up the rest of the line. Product build-up on the belt rose in the same time windows.
| Station | Boxes / hour | Active time | Belt density | Status |
|---|---|---|---|---|
| Boxing 1 | 42 | 91% | Normal | Balanced |
| Boxing 2 | 28 | 64% | High | Bottleneck |
| Boxing 3 | 39 | 88% | Normal | Balanced |
Results
Staffing and belt layout at the bottleneck stations were re-planned based on the data.
- Bottleneck stations and hours identified with data
- Staffing re-planned according to station load
- Line density and build-up monitored live
- Shift and day comparisons reported automatically
- Station-based measurement without tracking individuals
Related solutions
Frequently asked questions
Are individual workers tracked?
No. Measurement is station-based; pose analysis only determines whether work is happening at the station, and nobody is identified.
Do we need new cameras?
Existing cameras that see the lines from above are usually enough; camera angles are reviewed during discovery.