
Sewing, pressing and packing digitised at a garment factory: line-by-line counting and bottleneck analysisAt an apparel plant, existing cameras measured unit counts, cycle time per piece, station occupancy and line bottlenecks across sewing, pressing/quality control and packing; line leaders see their own line live.2026-10-12
At a multi-line garment factory, production tracking relied on hourly hand-written charts and end-of-shift counts. Which line was behind target only became clear at the end of the day, and which operation was holding the line up was unknown.
Hype Vision digitised sewing, pressing/quality control and packing using the plant's existing security cameras. Each station was defined as an analysis area; completed pieces, time per piece and active working ratio started to be measured automatically.
Line leaders counted hourly output by hand and wrote it on charts.
Sewing, pressing and packing counted automatically; Real time per piece measured and compared with SAM; Bottleneck operations and hours identified with data
Problem
Line leaders counted hourly output by hand and wrote it on charts. Counts were late, sometimes wrong and gave no per-operation detail.
When a pressing station fell behind or a sewing machine sat idle, it was only noticed at the end of the day when total output came in low. The bottleneck could not be shown with data.
Operation times (SAM) used in quoting and planning had never been compared with real times on the floor.
Sewing operations
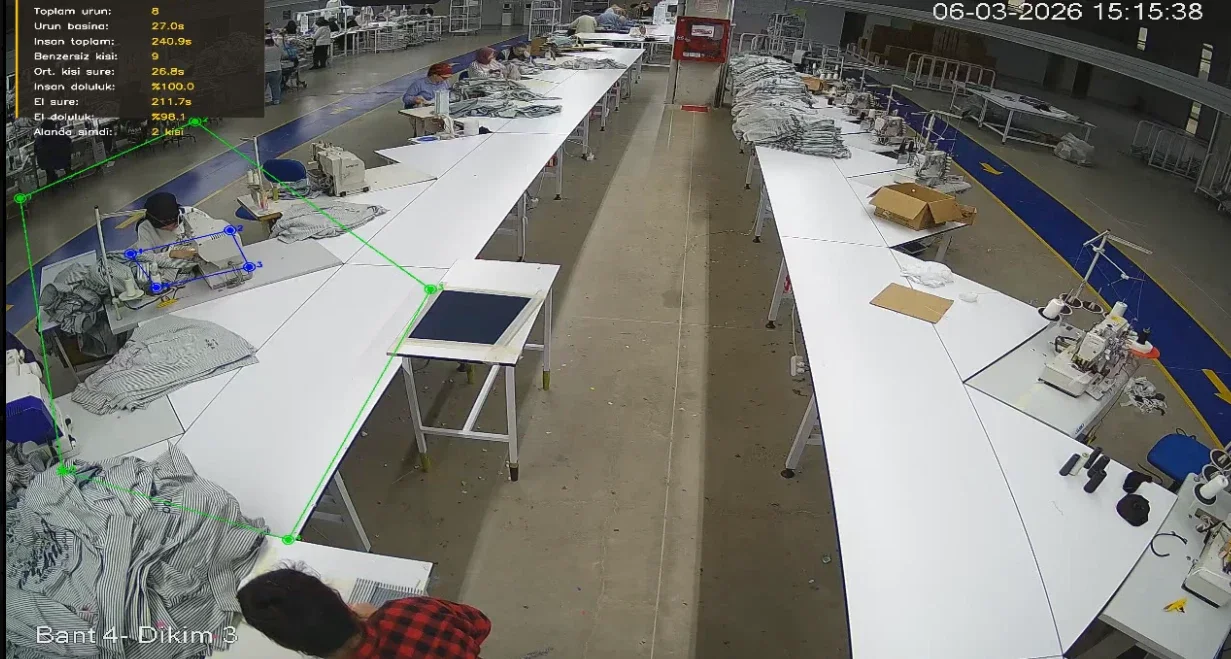
Sewing tables were defined as individual stations. Anonymous pose and hand tracking measure active time at the machine, when a piece arrives and when it is finished.
Time per piece, station occupancy and hand occupancy (share of time hands are actually working) are calculated per station. Differences between stations doing the same operation became visible for the first time.
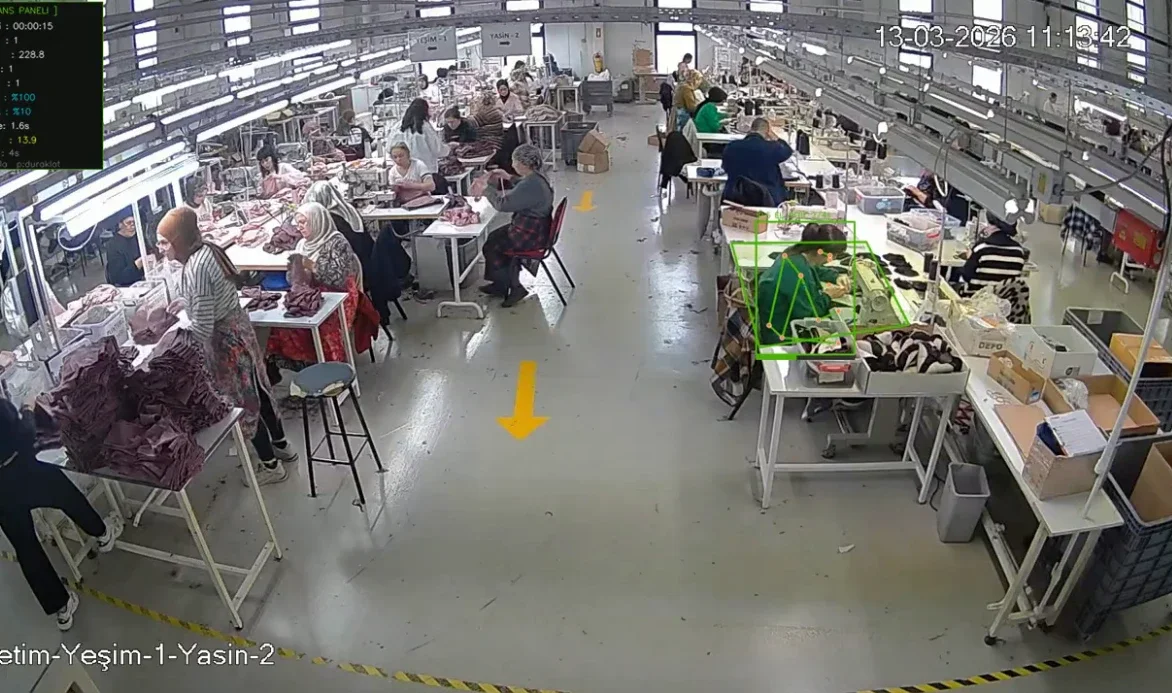
- Sewing time per piece and average
- Station occupancy
- Hand occupancy (active work ratio)
- Live people count in the area
- Comparison between similar operations
Pressing and quality control
At the pressing and QC tables at the end of the line, each garment arriving and leaving is counted. The dashboard shows the live count, station status (working / waiting) and a time log for every piece.
Deviations in pressing time per piece (e.g. 76 s vs 94 s) are visible immediately; long pieces flag quality issues, missing stitches or training needs.
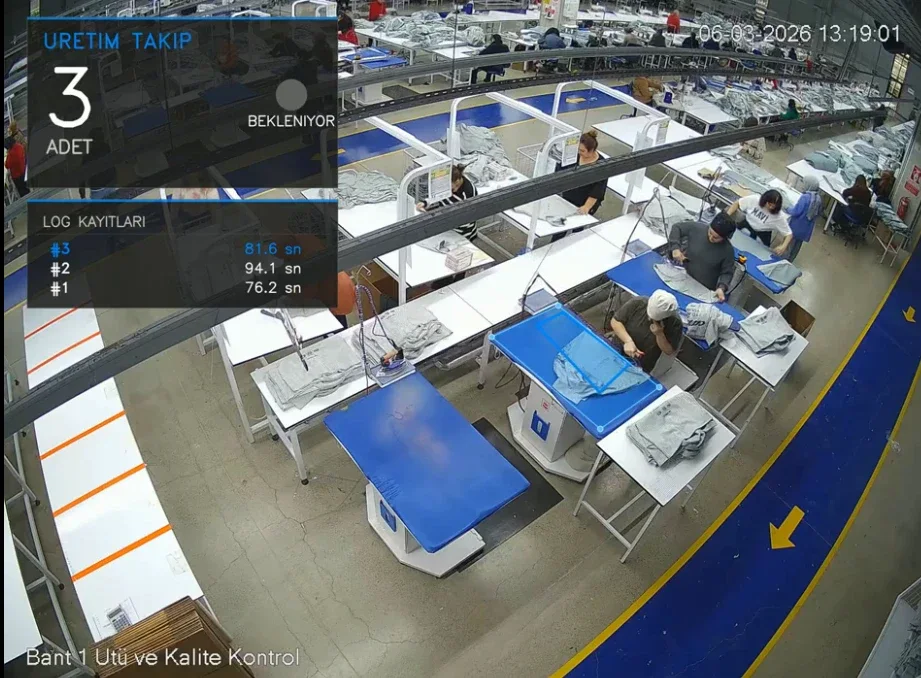
- Count per pressing table
- Pressing time log per piece
- Waiting / working status
- End-of-line QC output
Packing count
At packing stations, folded, bagged and boxed garments are counted. Packing output is compared with pressing output to calculate work-in-progress between them; ready-to-ship quantity is always known.
- Folding / bagging / boxing count
- WIP between pressing and packing
- Hourly packing rate
- Completion status per order
Line bottleneck analysis
Combining sewing, pressing and packing data on one timeline shows the line flow end to end. The station with low output, high occupancy and WIP piling up behind it is the bottleneck.
The analysis shows not only which station is slow but when: losses at shift start, after breaks or at style changeovers are reported separately.
| Operation | Pieces / hour | Avg. time per piece | Occupancy | Status |
|---|---|---|---|---|
| Sewing – side seam | 64 | 27 s | 96% | Balanced |
| Sewing – collar attach | 41 | 44 s | 99% | Bottleneck |
| Pressing & QC | 48 | 84 s | 92% | Balanced |
| Packing | 52 | 31 s | 71% | Waiting |
Live screen for line leaders
Each line leader sees only their own line: live count, status against target, bottleneck alerts and the latest time log. The plant manager compares all lines on one screen. Data can be exported to ERP/MES or Excel.
Privacy
Measurement is station- and operation-based; no face recognition is used and nobody is identified. Pose and hand tracking only determine whether work is happening at the station. Video is processed on site.
Results
Production tracking moved from hand-written charts to live, per-operation data.
- Sewing, pressing and packing counted automatically
- Real time per piece measured and compared with SAM
- Bottleneck operations and hours identified with data
- Staffing and line balancing driven by data
- Line leaders spot target deviations during the day
- No more hourly charts or end-of-shift counts
Related solutions
Frequently asked questions
Are individual workers tracked?
No. Measurement is station-based: how much work happens at a station, not who did it. No face recognition is used.
Do we need new cameras?
This project used existing security cameras. If the camera sees the tables and garments, no extra hardware is needed.
What happens at style changeover?
Operation definitions and targets are updated in the dashboard; counting and timing continue with the new style.
What can AI detect in your factory?
Let's review together which safety, quality and production analytics your existing security cameras can deliver.
- Free 15-minute technical call
- Camera infrastructure pre-assessment
- Feasible AI scenarios